Plot snowprofile
Simple plot
To have a quick overview of the main stratigrpahy stored in a SnowProfile object, the following function can be used:
- snowprofile.plot.plot_simple(sp, temperature_profiles=[0], density_profiles=[0], lwc_profiles=[0], hardness_profiles=[0], **kwargs)[source]
Quickly plot the data of a
snowprofile.snowprofile.SnowProfileobject.Once you have a SnowProfile object
sp, just do:import matplotlib.pyplot as plt from snowprofile.plot import plot_simple plot_simple(sp) plt.show()

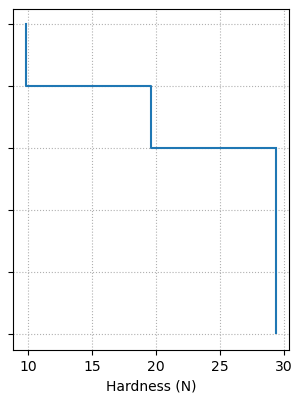
Example of a simple plot with the example of the profile observed on 2024-12-24 at Col de Porte (France).
- Parameters:
sp (SnowProfile object) – SnowProfile object to be plotted
temperature_profiles (None,
'all'or list of int) –'all'to plot all temperature profiles,Nonenot to plot temperature or list of indices of the profiles to plot.density_profiles (None,
'all'or list of int) –'all'to plot all density profiles,Nonenot to plot density or list of indices of the profiles to plot.lwc_profiles (None,
'all'or list of int) –'all'to plot all lwc profiles,Nonenot to plot lwc or list of indices of the profiles to plot.hardness_profiles (None,
'all'or list of int) –'all'to plot all hardness profiles,Nonenot to plot hardness or list of indices of the profiles to plot.
- Returns:
Matplotlib figure
Plot all profiles
To plot the content of a SnowProfile object, the following function can be used:
- snowprofile.plot.plot_full(sp, index_temperature_profiles='all', index_density_profiles='all', style_density_profiles='step', index_hardness_profiles='all', style_hardness_profiles='step', index_impurity_profiles='all', style_impurity_profiles='point', index_ssa_profiles='all', style_ssa_profiles='point', index_strength_profiles='all', style_strength_profiles='point', index_lwc_profiles='all', style_lwc_profiles='step', index_scalar_profiles='all', **kwargs)[source]
Plot the data (only the vertical property profiles) of a
snowprofile.snowprofile.SnowProfileobject.Once you have a SnowProfile object
sp, just do:import matplotlib.pyplot as plt from snowprofile.plot import plot_full plot_full(sp) plt.show()

Style : to be chosen for nearly all variables : may be
'point'to plot with markers or'step'to do a step plot (only possible when thickness is correctly provided).Index: Except for stratigraphy, several profiles of each variables can be stored in SnowProfile object. You can select the profiles to plot by passing a list of indices or use the default value
'all'to plot all available profiles.- Parameters:
sp (SnowProfile object) – SnowProfile object to be plotted
index_temperature_profiles (list of int) – index of the temperature profile to be plotted
style_hardness_profiles (str) – plotting style for hardness profiles
style_impurity_profiles (str) – plotting style for impurity profiles
index_ssa_profiles (list of int) – index of the ssa profile to be plotted
style_ssa_profiles (str) – plotting style for SSA profiles
index_strength_profiles (list of int) – index of the strength profile to be plotted
style_strength_profiles (str) – plotting style for strength profiles
index_lwc_profiles (list of int) – index of the lwc profile to be plotted
style_lwc_profiles (str) – plotting style for LWC profiles
index_density_profiles (list of int) – index of the density profile to be plotted
style_density_profiles (str) – plotting style for density profiles
- Returns:
Matplotlib figure
Plotting routines to construct your own plot
The package provide routines to plot some parts of SnowProfile objects on matplotlib axes so that you can compose your own plot. All these elements are gathered in snowprofile.plot.plot_utils:
- snowprofile.plot.plot_utils.plot_point_profile(ax, variable_profiles, name_profile, index_profiles, xlabel='Variable (unit)', ylabel='Height (m)', color=None, **kwargs)[source]
Function to plot a set of profiles on an axis.

- snowprofile.plot.plot_utils.plot_step_profile(ax, variable_profiles, name_profile, index_profiles, xlabel='Variable (unit)', ylabel='Height (m)', color=None, **kwargs)[source]
Function to plot a set of profiles on an axis.
- snowprofile.plot.plot_utils.plot_strati_profile(ax, stratigraphy, xlabel='Hand harness', ylabel='Height (m)', grain_labels=True, use_hardness=True, **kwargs)[source]
Plot stratigraphy- (layers, colored according to grains, with grain symbol and with the hand-hardness)

- Parameters:
ax (Matplotlib axis) – Matplotlib axis to plot on
stratigraphy (
snowprofile.classes.Stratigraphy) – SnowProfile stratigraphy element to plotxlabel (str) – The x-axis label
ylabel (str) – The y-ayis label
grain_labels (bool) – Whether or not to plot the grain labels
use_hardness – Whether or not to use the hand hardness
